
Cato XDR Story Similarity – A Data Driven Incident Comparison and Severity Prediction Model


|
Listen to post:
Getting your Trinity Audio player ready...
|
At Cato our number one goal has always been to simplify networking and security, we even wrote it on a cake once so it must be true:

Figure 1 – A birthday cake
Applying this principle to our XDR offering, we aimed at reducing the complexity of analyzing security and network incidents, using a data-driven approach that is based on the vast amounts of data we see across our global network and collect into our data lake. On top of that, being able to provide a prediction of the threat type and the predicted verdict, i.e. if it is benign or suspicious.
Upon analyzing XDR stories – a summary of events that comprise a network or security incident – many similarities can be observed both inside the network of a given customer, and even more so between different customers’ networks.
Meaning, eventually a good deal of network and security incidents that occur in one network have a good chance of recurring in another. Akin to the MITRE ATT&CK Framework, which aims to group and inventory attack techniques demonstrating that there is always similarity of one sort or another between attacks.
For example, a phishing campaign targeted at a specific industry, e.g. the banking sector, will likely repeat itself in multiple customer accounts from that same industry. In essence this allows crowdsourcing of sorts where all customers can benefit from the sum of our network and data.
An important note is that we will never share data of one customer with another, upholding to our very strict privacy measures and data governance, but by comparing attacks and story verdicts across accounts we can still provide accurate predictions without sharing any data.
The conclusion is that by learning from the past we can predict the future, using a combination of statistical algorithms we can determine with a high probability if a new story is related to a previously seen story and the likelihood of it being the same story with the same verdict, in turn cutting down the time to analyze the incident, freeing up the security team’s time to work on resolving it.
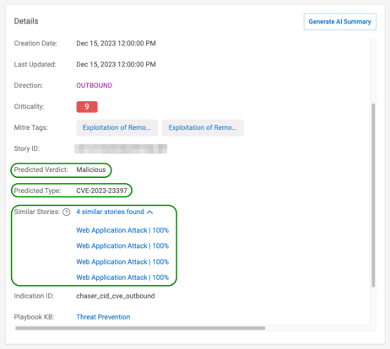
Figure 2 – A XDR story with similarities
The similarity metric – Jaccard Similarity Coefficient
To identify whether incidents share a similarity we look at the targets, i.e. the destination domains/IPs involved in the incident, going over all our data and grouping the targets into clusters we then need to measure the strength of the relation between the clusters.
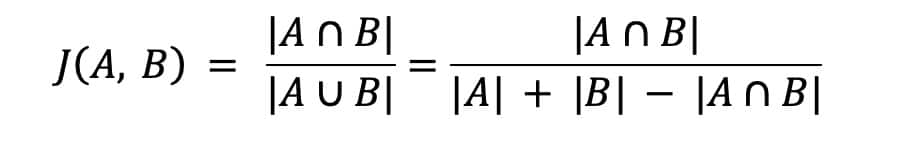
To measure that we use the Jaccard index (also known as Jaccard similarity coefficient). The Jaccard coefficient measures similarity between finite sample sets, and is defined as the size of the intersection divided by the size of the union of the sample sets:
Taking a more graphic example, given two sets of domains (i.e. targets), we can calculate the following by looking Figure 3 below.
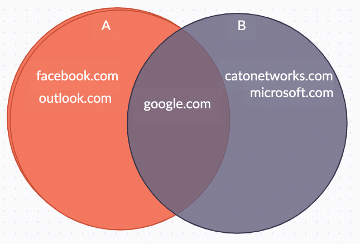
Figure 3
The size of the intersection between sets A & B is 1 (google.com), and the size of the union is 5 (all domains summed). The Jaccard similarity between the sets would be 1/5 = 0.2 or in other words, if A & B are security incidents that involved these target domains, they have a similarity of 20%, which is a weak indicator and hence they should not be used to predict the other.
The verification model – Louvain Algorithm
Modularity is a measure used in community detection algorithms to assess the quality of a partition of a network into communities. It quantifies how well the nodes in a community are connected compared to how we would expect them to be connected in a random network. Using the Louvain algorithm, we detected communities of cyber incidents by considering common targets and using Jaccard similarity as the distance metric between incidents.
Modularity ranges from -1 to 1, where a value close to 1 indicates a strong community structure within the network. Therefore, the modularity score achieved provides sufficient evidence that our approach of utilizing common targets is effective in identifying communities of related cyber incidents.
To understand how modularity is calculated, let’s consider a simplified example. Suppose we have a network of 10 cyber incidents, and our algorithm identifies two communities.
Each community consists of the following incidents:
Community 1: Incidents {A, B, C, D}
Community 2: Incidents {E, F, G, H, I, J}
The total number of edges connecting the incidents within each community can be calculated as follows:
Community 1: 6 edges (A-B, A-C, A-D, B-C, B-D, C-D)
Community 2: 15 edges (E-F, E-G, E-H, E-I, E-J, F-G, F-H, F-I, F-J, G-H, G-I, G-J, H-I, H-J, I-J)
Additionally, we can calculate the total number of edges in the entire network:
Total edges: 21 (6 within Community 1 + 15 within Community 2)
Now, let’s calculate the expected number of edges in a random network with the same node degrees.
The node degrees in our network are as follows:
Community 1: 3 (A, B, C, and D have a degree of 3)
Community 2: 5 (E, F, G, H, I, and J have a degree of 5)
To calculate the expected number of edges, we can use the following formula:
Expected edges between two nodes (i, j) = (degree of node i * degree of node j) / (2 * total edges)
For example, the expected number of edges between nodes A and B would be:
(3 * 3) / (2 * 21) = 0.214
By calculating the expected number of edges for all pairs of nodes, we can obtain the expected number of edges within each community and in the entire network. Finally, we can use these values to calculate the modularity using the formula:
Modularity = (actual number of edges - expected number of edges) / total edges
The Louvain algorithm works iteratively to maximize the modularity score. It starts by assigning each node to its own community and then iteratively moves nodes between communities to increase the modularity value. The algorithm continues this process until no further improvement in modularity can be achieved.
A practical example, in figure 4 below, using Gephi (an open-source graph visualization application), we have an example of a customers’ cyber incidents graph. The nodes are the cyber incidents, and the edges are weighted using the Jaccard similarity metric.
We can see clear division of clusters with interconnected incidents showing that using Jaccard similarity on common targets is having great results. The colors of the clusters are based on the cyber incident type, and we can see that our approach is confirmed by having cyber incidents of multiple types clustered together. The big cluster in the center is composed of three very similar cyber incident types. This customers’ incidents in this example achieved a modularity score of 0.75.
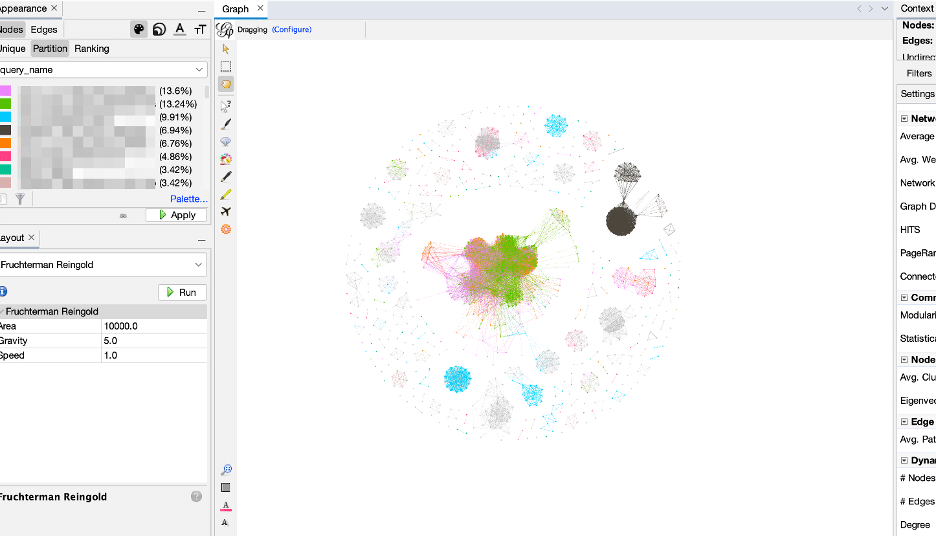
Figure 4 – Modularity verification visualization using Gephi
In summary, the modularity value obtained after applying the Louvain algorithm over the entire dataset of customers and incidents, is about 0.71, which is considered high. This indicated that our approach of using common targets and Jaccard similarity as the distance metric is effective in detecting communities of cyber incidents in the network and served as validation of the design.
The Industry’s First SASE-based XDR Has Arrived | Download the eBookArchitecting to run at scale
The above was a very simplified example of how to measure similarity. Running this at scale over our entire data lake presented a scaling challenge that we opted to solve using a serverless architecture that can scale on-demand based on AWS Lambda.
Lambda is an event-driven serverless platform allowing you to run code/specific functions on-demand and to scale automatically using an API Gateway service in front of your Lambdas.
In the figure below we can see the distribution of Lambda invocations over a given week, and the number of parallel executions demonstrating the flexibility and scaling that the architecture allows for.
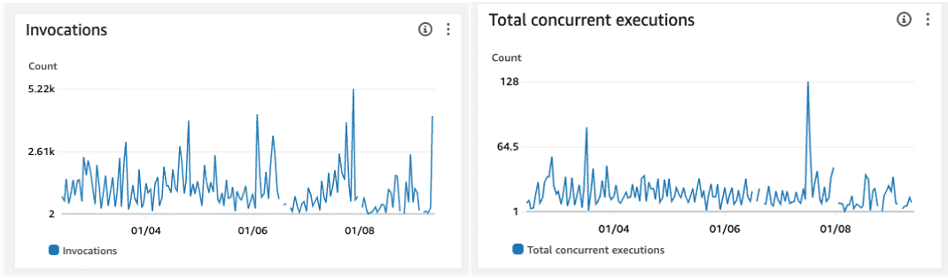
Figure 5 – AWS Lambda execution metrics
The Cato XDR Service runs on top of data from our data lake once a day, creating all the XDR stories. Part of every story creation is also to determine the similarity score, achieved by invoking the Lambda function.
Oftentimes Lambda’s are ready to use functions that contain the code inside the Lambda, in our case to fit our development and deployment models we chose to use Lambda’s ability to run Docker images through ECR (Elastic Container Registry). The similarity model is coded in Python, which runs inside the Docker image, executed by Lambda every time it runs.
The backend of the Lambda is a DocumentDB cluster, a NoSQL database offered by AWS which is also MongoDB compliant and performs very well for querying large datasets. In the DB we store the last 6 months of story similarity data, and every invocation of the Lambda uses this data to determine similarity by applying the Jaccard index on the data, returning a dataset with the results back to the XDR service.
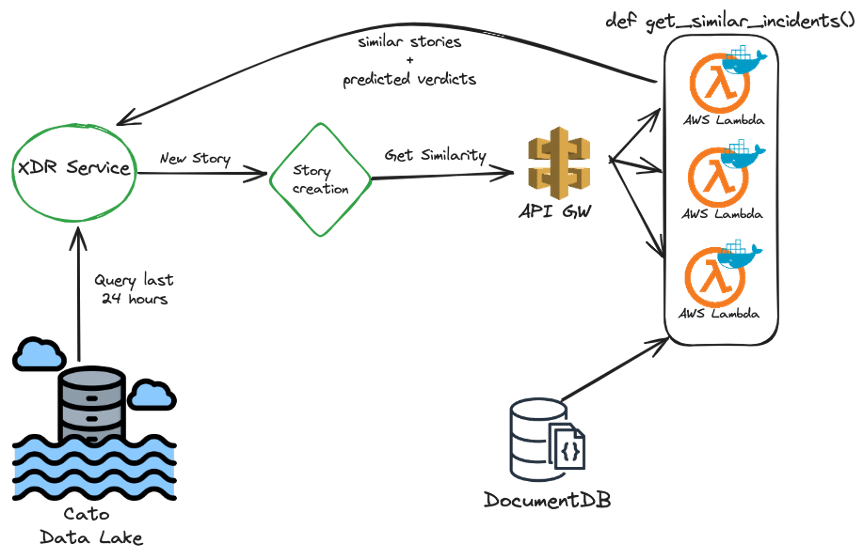
Figure 6 – High level diagram of similarity calculation with Lambda
An additional standalone phase of this workflow is keeping the DocDB database up to date with data of stories and targets to keep similarity calculation relevant and accurate.
The update phase runs daily, orchestrated using Apache Airflow, an open-source workflow management platform which is very suited for this and used for many of our data engineering workflows as well. Airflow triggers a different Lambda instance, technically running the same Docker image as before but invoking a different function to update the database.
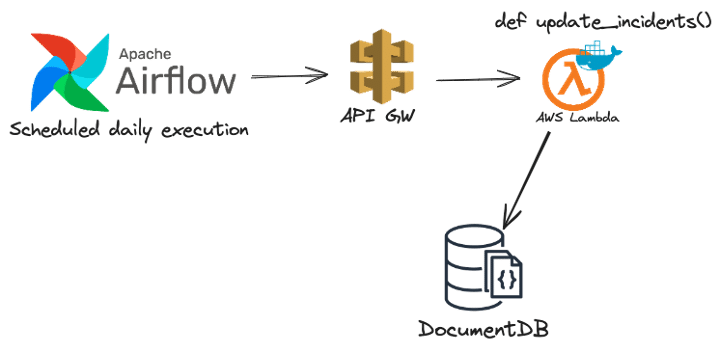
Figure 7 – DocDB update workflow
Ultimate impact and what’s next
We’ve reviewed how by leveraging a data-driven approach we were able to address the complexity of analyzing security and network incidents by linking them to already identified threats and predicting their verdict.
Overall, in our analysis we saw that a little over 30% of incidents have a similar incident linked to them, this is a very strong and indicative result, ultimately meaning we can help reduce the time it takes to investigate a third of the incidents across a network.
As IT & Security teams continue to struggle with staff shortages to keep up with the ongoing and constant flow of cybersecurity incidents, capabilities such as this go a long way to reduce the workload and fatigue, allowing teams to focus on what’s important.
Using effective and easy to implement algorithms coupled with a highly scalable serverless infrastructure using AWS Lambda we were able to achieve a powerful solution that can meet the requirement of processing massive amounts of data.
Future enhancements being researched involve comparing entire XDR stories to provide an even stronger prediction model, for example by identifying similarity between incidents even if they do not share the same targets through different vectors.
Stay tuned.
Related Articles
When AI Can Act: Governing OpenClaw


AIOps in the Cato SASE Platform: Using Predictive AI Networking to Shift from Reactive to Proactive IT

OpenClaw: Cato Governance Controls and Sector Exposure Insights from the Cato SASE Platform