
The GitHub Outage: How AI-Native SASE Visibility Turns Disruption into Decision





|
Listen to post:
🔊 This audio player requires that "Preferences" cookies be accepted
|
On August 17, 2026 at 13:40 UTC, GitHub first publicly logged that it was investigating elevated errors and latency issues, later reporting broad impact across web and API traffic, Git operations, Actions, Pull Requests, Issues, Pages, Webhooks, and identity-related services.
The outage had significant implications for development teams. When GitHub degrades, developer workflows can stop quickly. Code cannot be pushed or pulled, pull requests and CI/CD workflows can stall, dependencies and release assets may be unavailable, and a production fix can sit unmerged.
For IT teams, the GitHub outage provides a perfect example of the power of Cato DEM. With DEM, Cato customers gained early warning of impending outages, providing developments teams with valuable time to protect unpushed work, hold nonessential pipeline runs, and focus support on the developers who are actually affected.
What we observed
At the time of the event, Cato internal systems immediately observed the outage’s impact. HTTP errors on Cato users’ GitHub sessions spiked from their normal baseline to 34.8%; average latency of those HTTP sessions peaked at 1,639 ms (see Figure 1). The subsequent decline in errors and latency reflects the recovery of GitHub service, as GitHub progressed through mitigation and restoration activities reported on its status page.
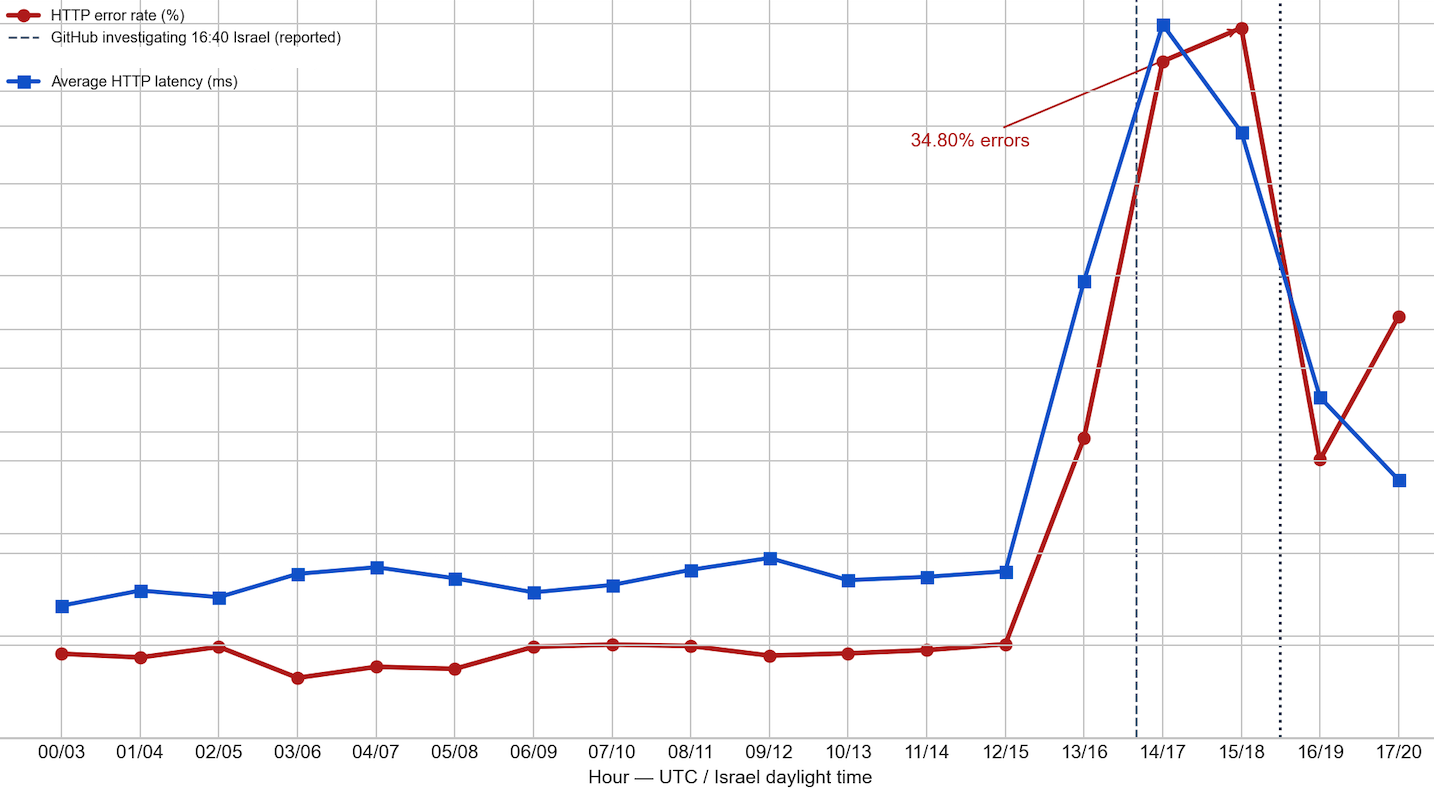
Figure 1. GitHub errors and latency spike during the event.
In theory, the errors could stem from a network issue, but that was quickly disproven by comparing GitHub performance with the performance of other applications. During the same time window, GitHub sessions showed materially higher error rates than Exchange Outlook, Microsoft Teams, Slack, and Zoom (Figure 2). Because the other SaaS applications remained comparatively stable, the pattern was more consistent with a GitHub-side service issue than with a broad problem in the enterprise access path.
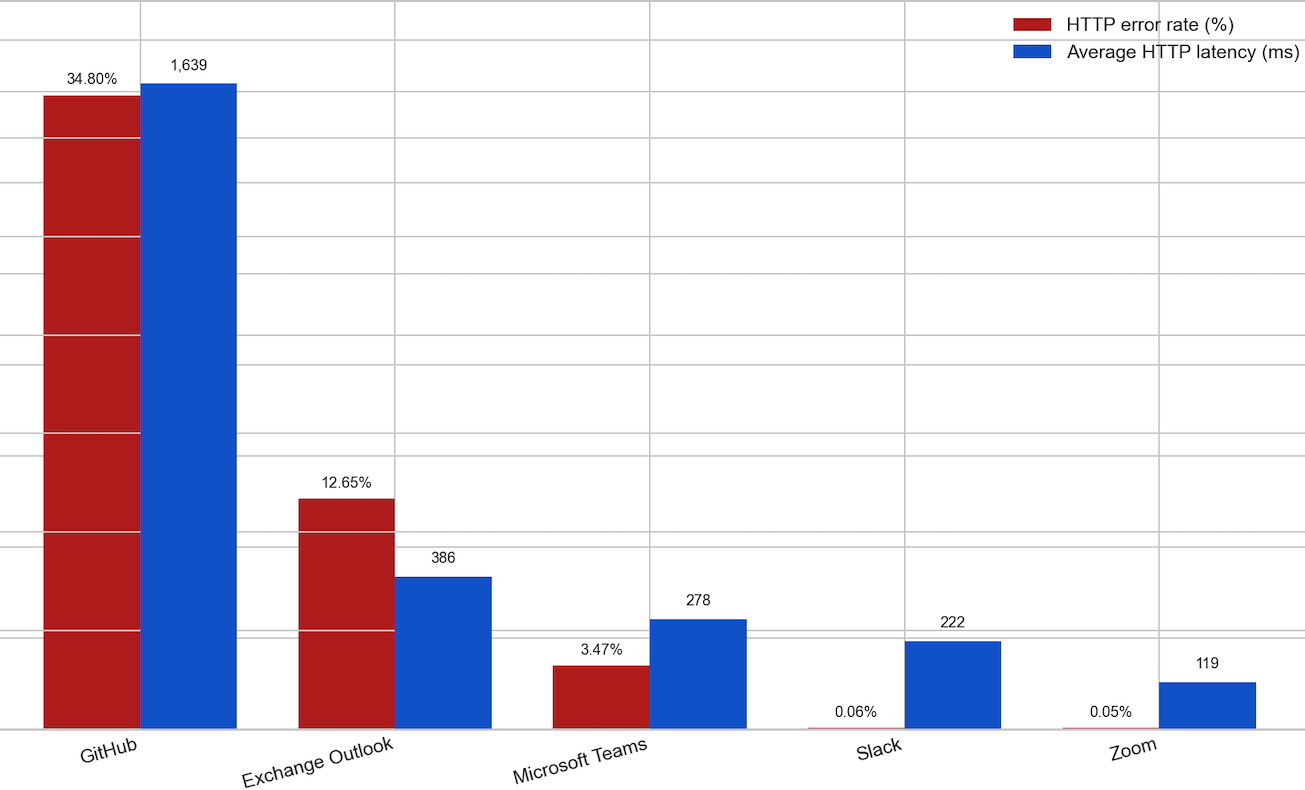
Figure 2. GitHub has the highest observed impact across compared SaaS apps.
What our customers observe
As the GitHub service degraded, customers could use Cato DEM to understand potential impact on their own environment. No GitHub-specific monitoring had to be configured in advance. Cato DEM uses application-experience data from real user traffic already traversing the Cato Cloud, allowing it to surface GitHub performance anomalies without dedicated sensors, integrations, or synthetic tests. IT can then quickly assess which users, sites, and applications may be affected.
Watch the demo: See how Cato DEM surfaces application degradation and lets teams investigate affected users, sites, latency, and HTTP errors.
Two complementary views add context during an incident. Regional metrics in Experience Monitoring reveal broad application-experience patterns across the Cato SASE Platform, which can provide early context for a developing SaaS event. In this case, GitHub’s experience rating had fallen to “Fair” before 8:00 a.m. (Figure 3), indicating developing degradation.
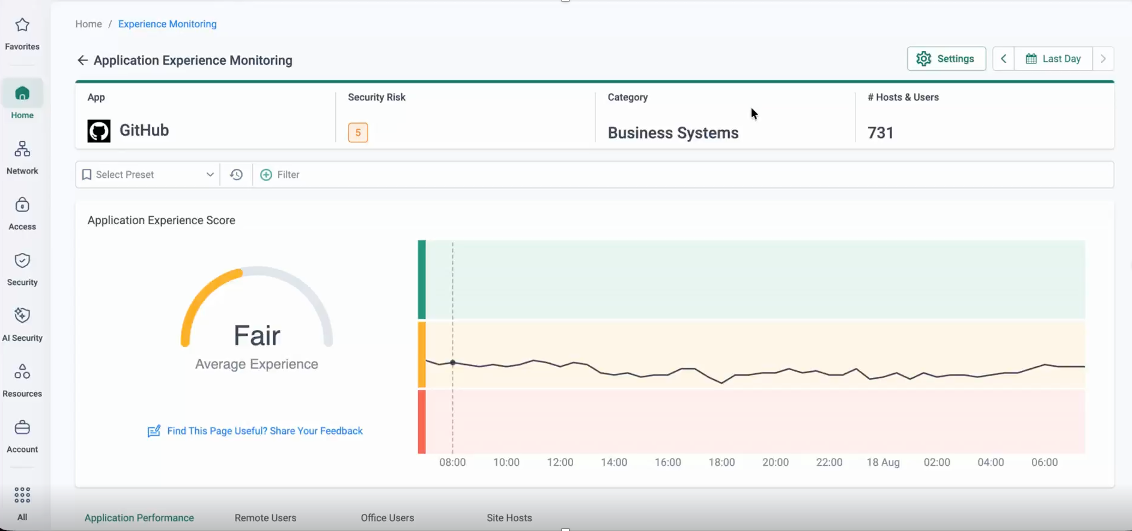
Figure 3. GitHub’s application’s experience had dropped
Observing the degradation, Cato customers could investigate the problem using per-account detection. This view focuses on each customer’s own experience against its baseline. The aim is not only to establish root cause, but to identify which applications, users, and sites are showing degradation and decide whether to investigate the enterprise access path or seek provider updates.
The account-level view of Experience Monitoring (Figure 4) brings site, remote user, office user, and application health together with the GitHub anomaly feed, helping a customer’s operations teams understand whether an issue is isolated or broadly affecting their environment.
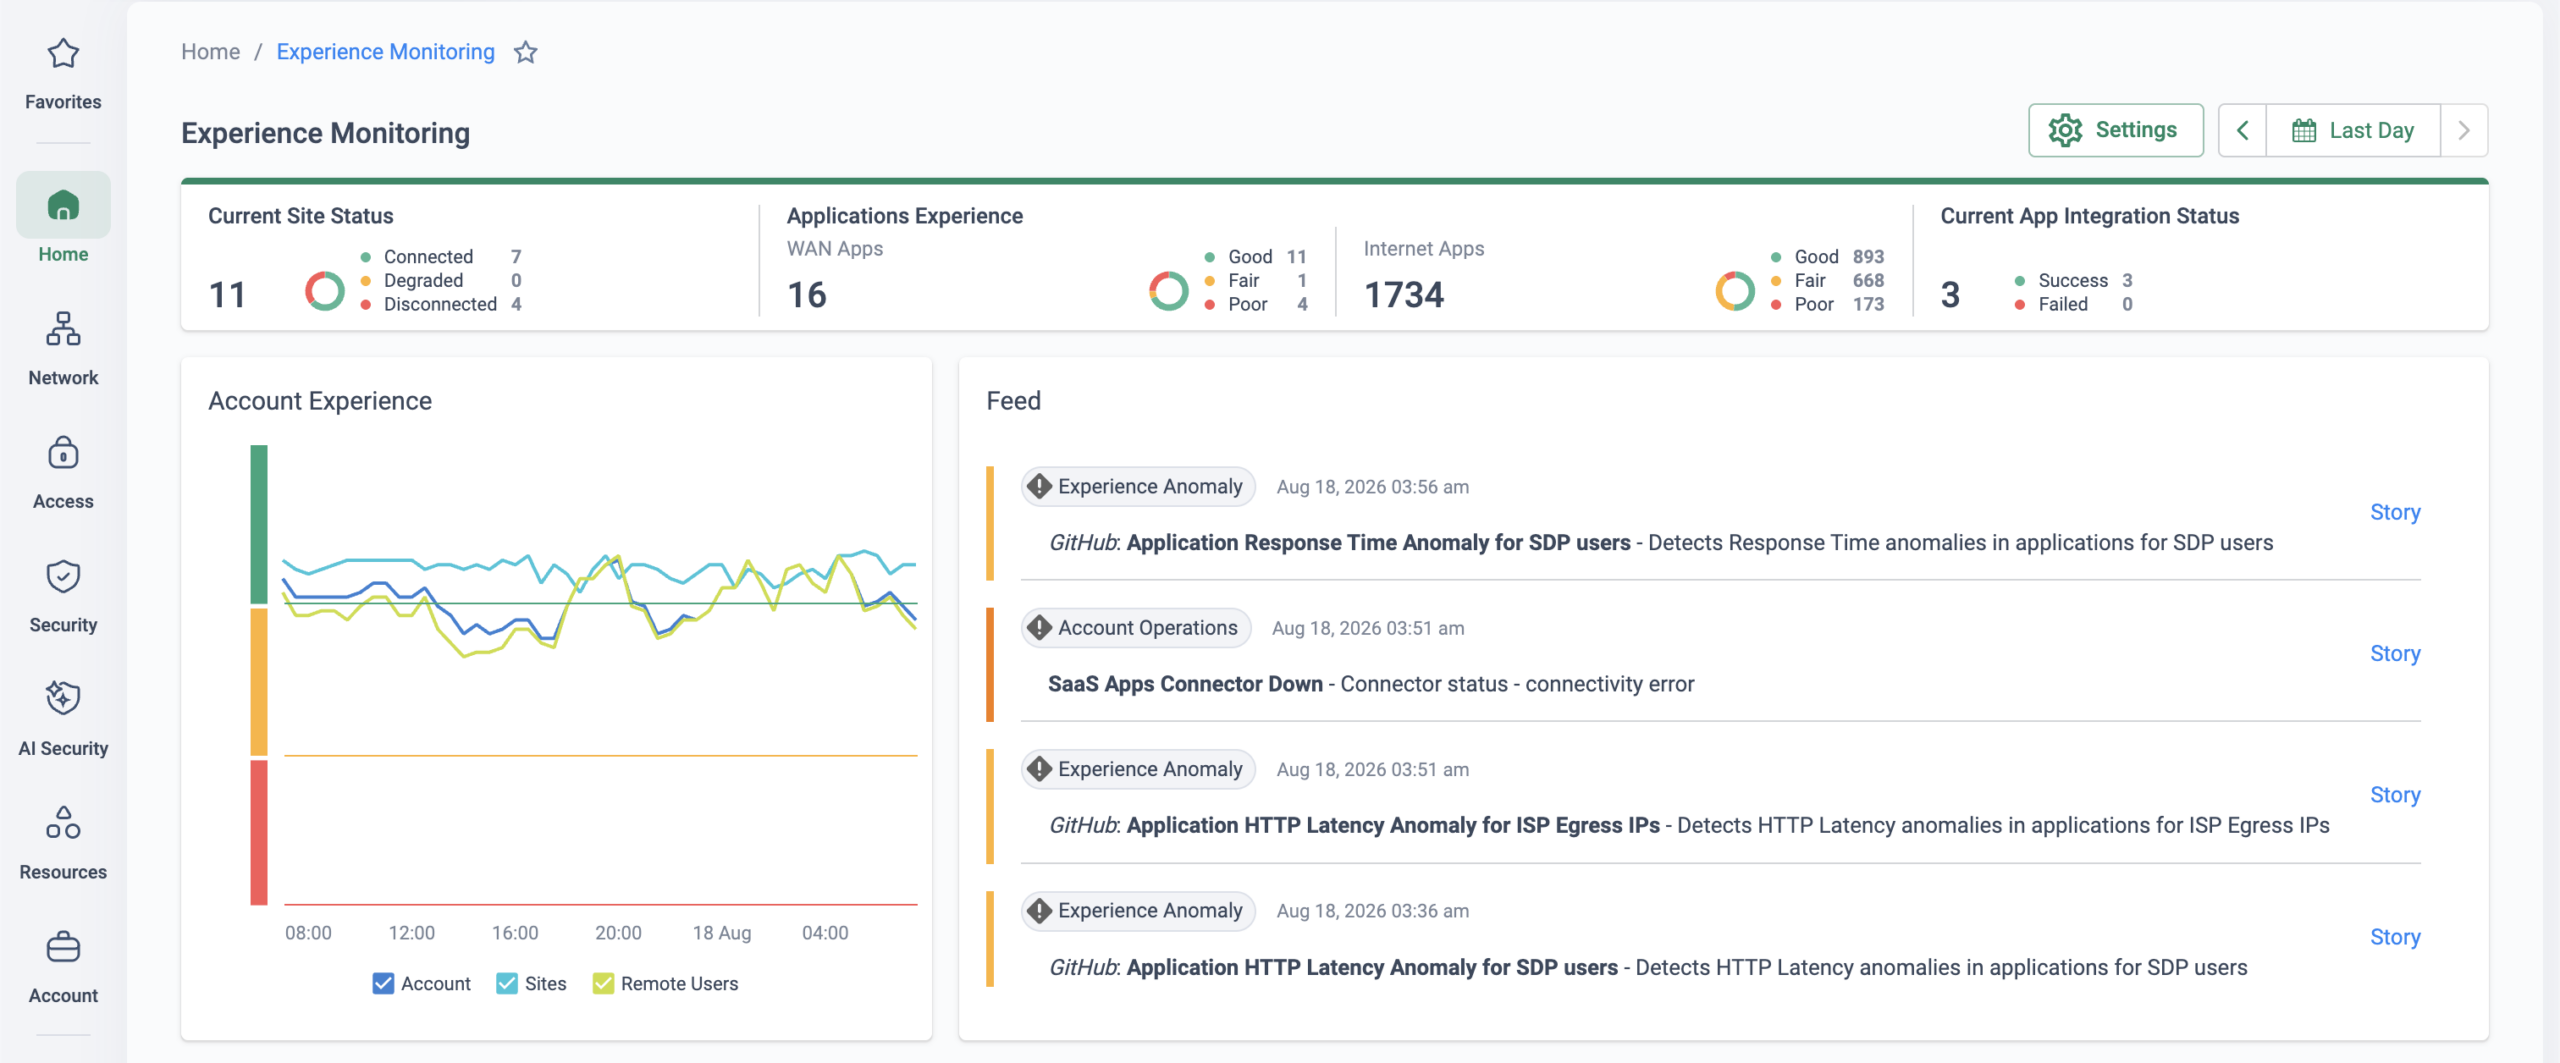
Figure 4. Account, site, remote user, and application experience in one view.
Seeing GitHub degradation through real-user monitoring
Passive real-user monitoring observes the experience of actual user sessions as traffic traverses Cato. It is continuous rather than a scheduled sample, which provides the evidence to break an incident down by user, site, application, and, where available, ISP egress path.
Cato’s synthetic monitoring answers a different question. It periodically runs a configured test from selected vantage points. It is useful for validating known paths, but it does not automatically reveal the full impact on users between checks.
During the GitHub incident, both monitoring modes mattered. Passive real-user monitoring meant that nobody needed to configure a separate GitHub monitor before the event. The relevant traffic was already traversing Cato, allowing teams to observe the developing experience degradation and investigate its impact on affected users and workflows.
By tapping synthetic monitoring, customers could examine an impending outage to identify affected individuals. The event details associate a GitHub response-time anomaly with a specific user, department, and baseline, allowing the customer to identify who needs support and prioritize the most disrupted development teams (see Figure 5).
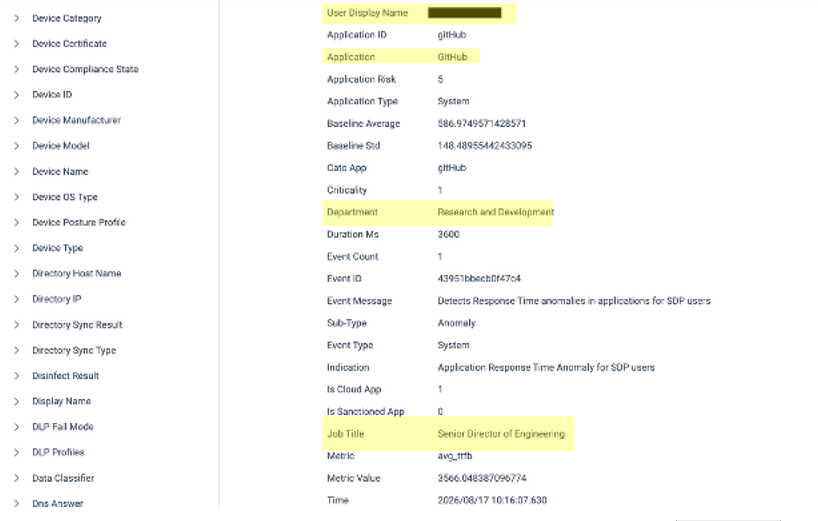
Figure 5. A user-level event ties a GitHub slowdown to an affected developer complete with the user name, department, and title.
For further evidence of the outage, IT teams can use the Events view, filtering for GitHub response-time anomalies. The customer can then examine the incident window and drill into individual signals instead of relying on a single aggregate chart (see Figure 6).
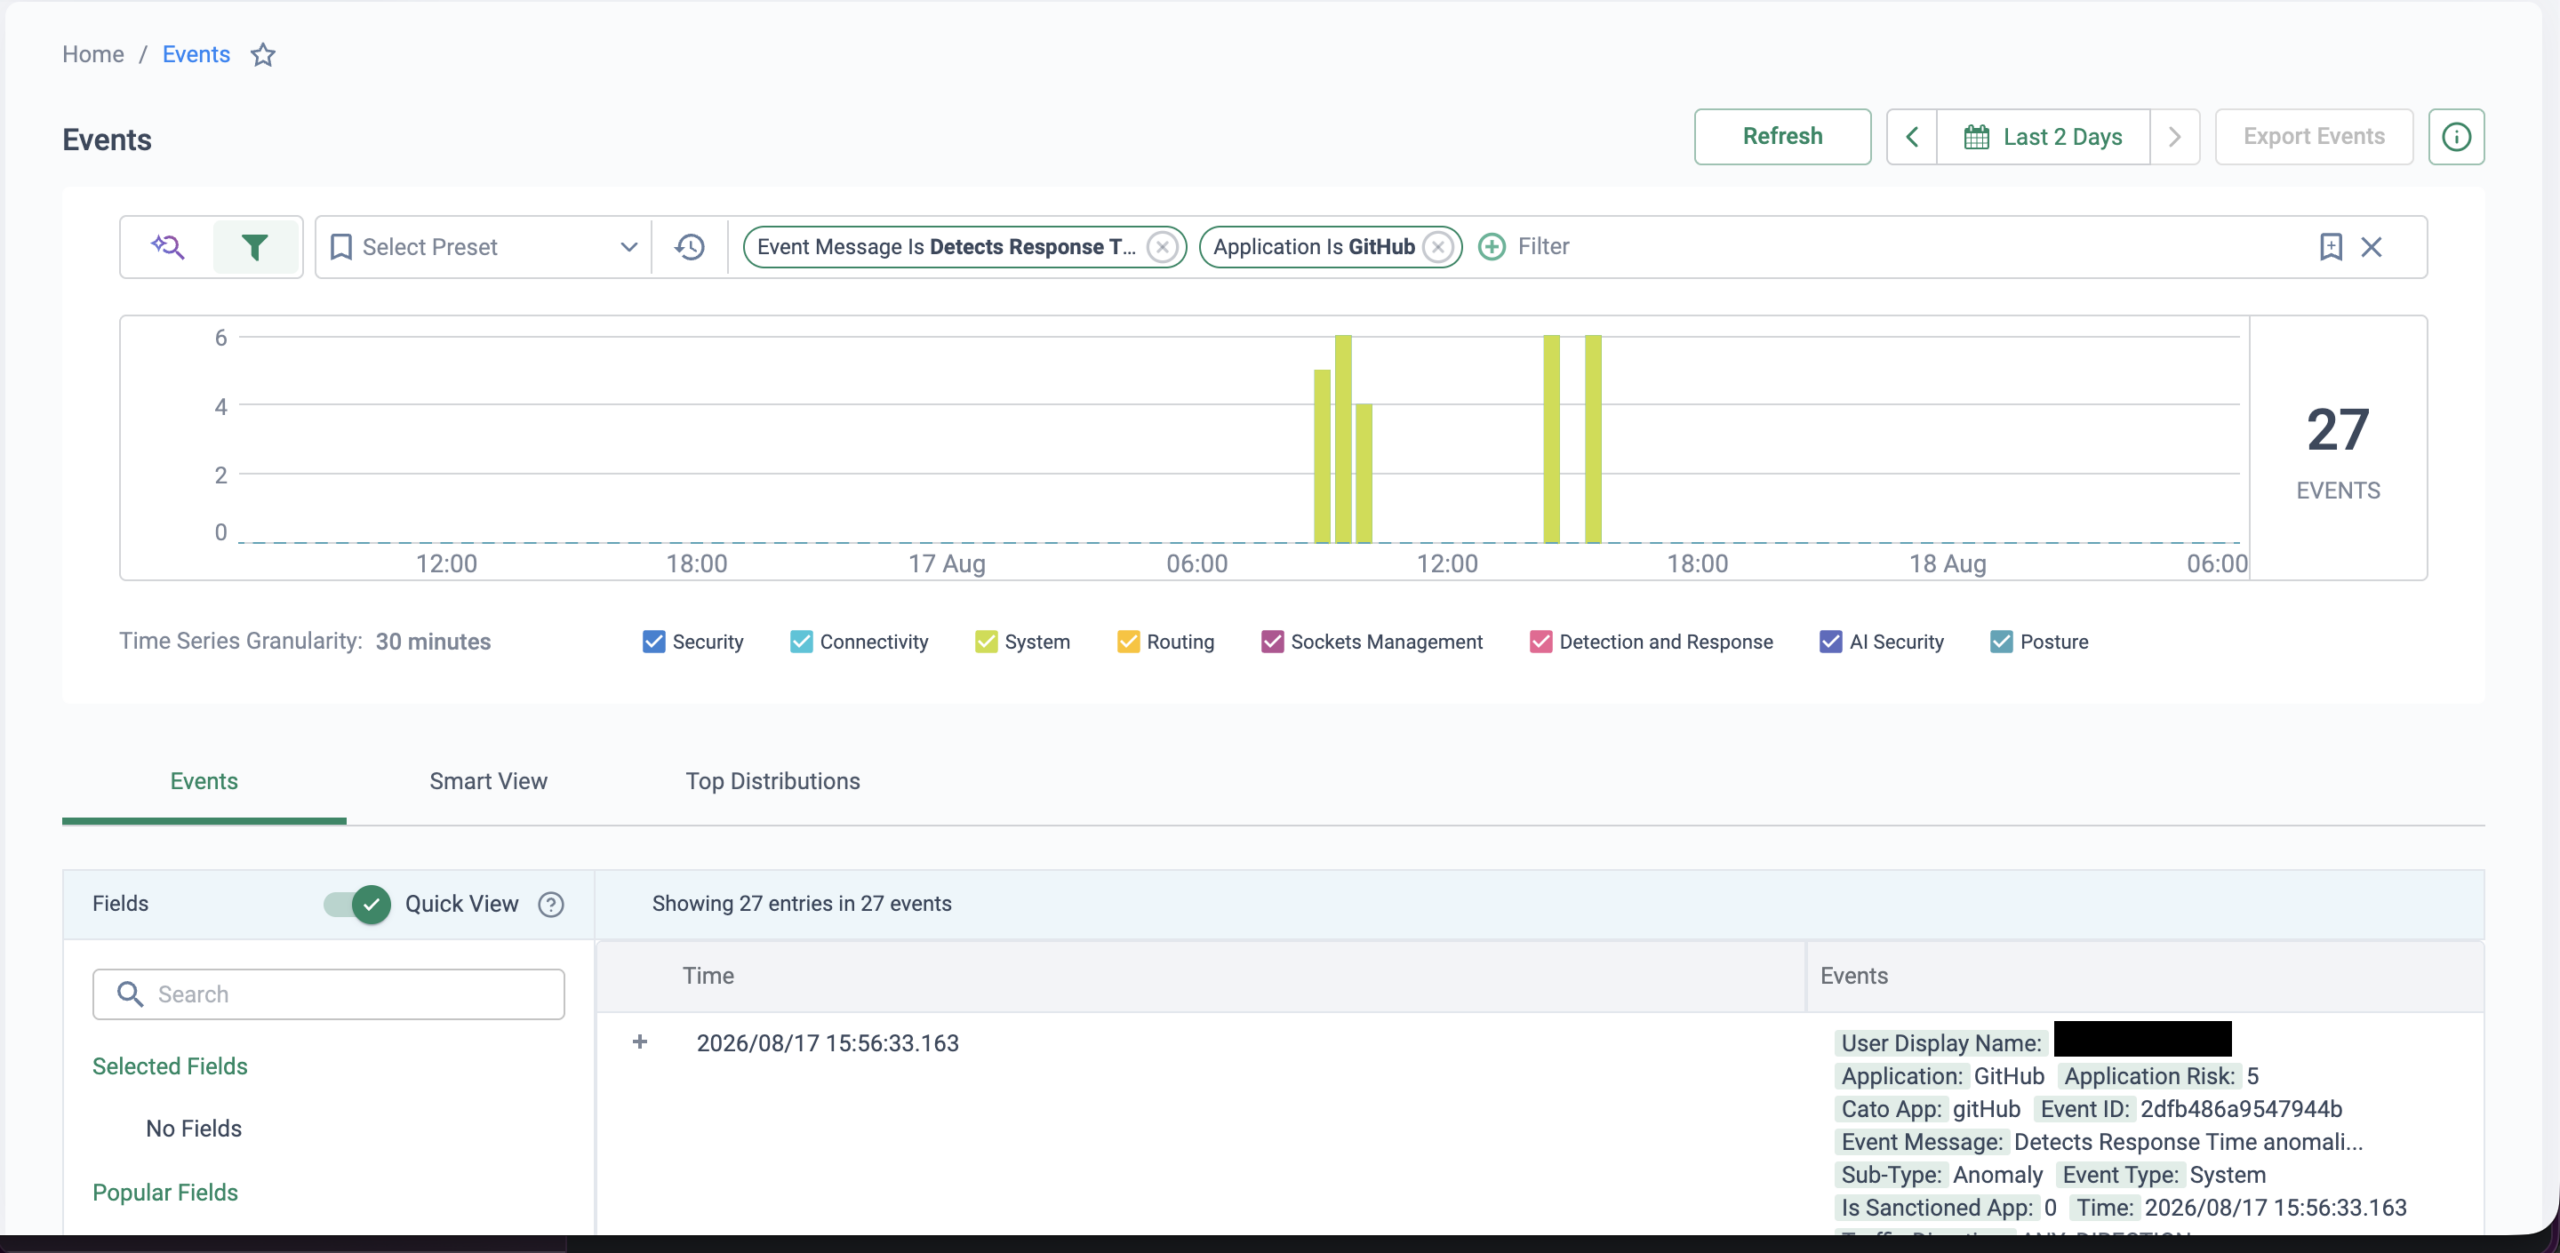
Figure 6. A filtered event trail shows GitHub anomalies during the incident.
From anomaly detection to root-cause analysis
In addition to DEM, Cato also surfaces application anomalies in Cato XOps. The Experience Monitoring anomaly engine analyzes application experience against learned baselines, so operations teams can move from a detected anomaly to a guided investigation. In this case, the Incident Timeline within Experience Monitoring records repeated response-time anomaly events affecting applications for ZTNA clients (see Figure 7).
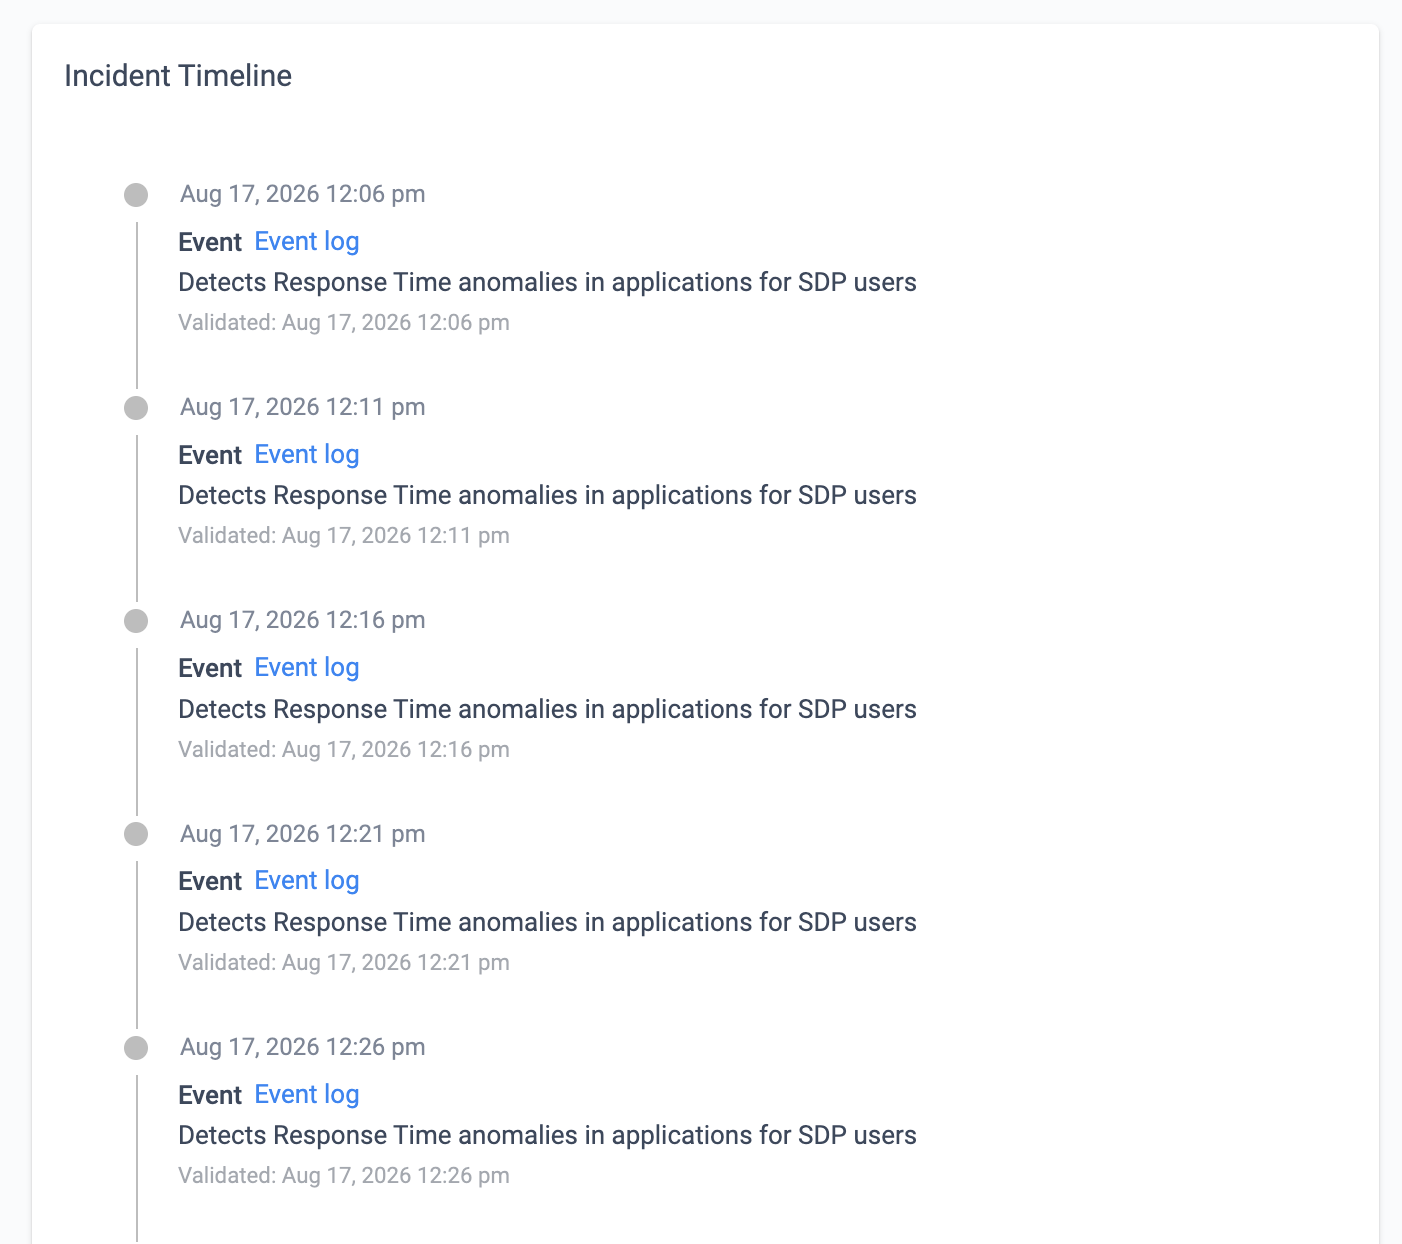
Figure 7. Response-time anomalies are flagged for ZTNA clients.
When an affected user needs deeper investigation, AIOps (within Cato XOps) can turn the collected experience signals into a root-cause analysis.
The same AI-assisted investigation can begin from different operational contexts. An operator can start with Ask AI when investigating a broader question (Figure 8), or from the DEM user view when investigating a specific affected user (Figure 9). In both cases, the analysis brings together the relevant experience signals and presents a concise explanation of the likely cause.
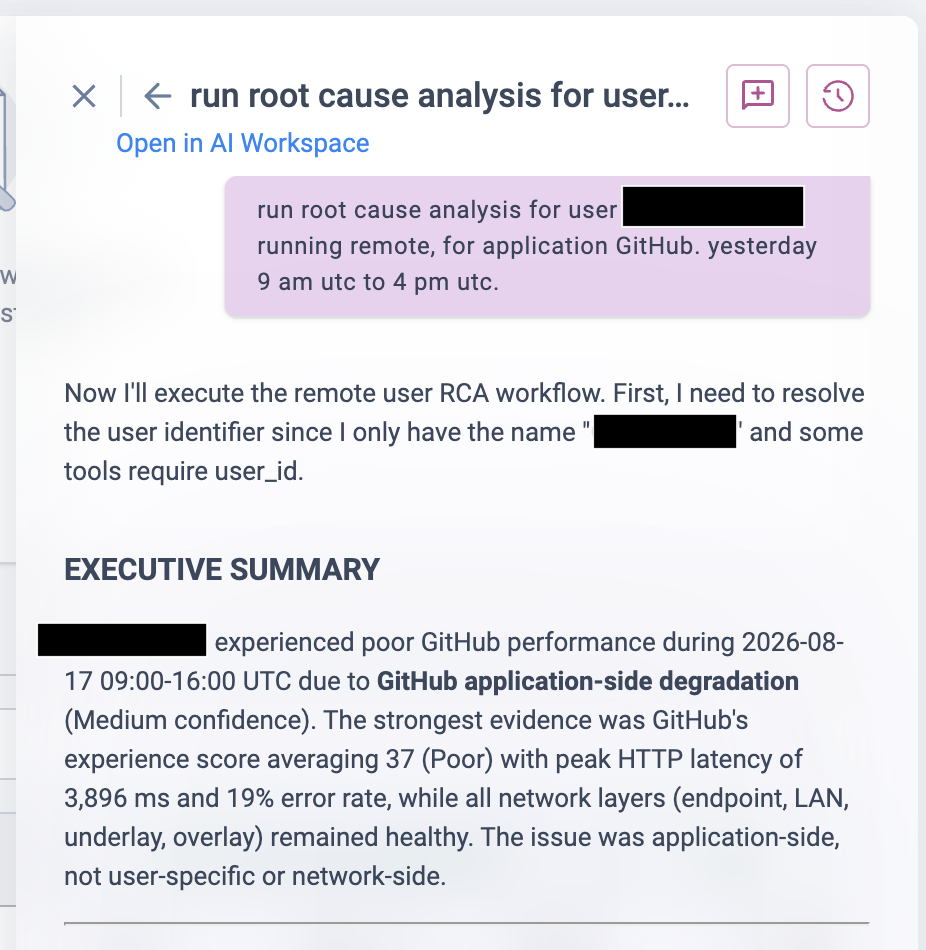
Figure 8. Investigation from Ask AI and receive an executive summary of the likely cause.

Figure 9. Start root-cause analysis from the DEM user view for an affected GitHub user.
Turning disruption into readiness
A GitHub outage disrupts software delivery, not just access to a website. While teams cannot repair an upstream issue, early signals and customer-specific impact data can guide a safer response: identify affected workflows, preserve unpushed work, hold nonessential pipeline runs, and avoid unnecessary network or security changes. The result is less wasted engineering time and stronger readiness for the next disruption.


Related Articles
How Cato handled record-breaking traffic after Japan’s return from the Obon holiday

Zero Trust for the East/West Battleground

Beyond Access: How Cato Measures and Manages User Risk in Real Time